

WATER QUALITY MONITORING
Our volunteer community scientists collect water quality data and monitor the ecological health of creeks in the Southern Bay Area. They also learn about the local plants and animals that live in our local waterways as well as observe and report sources of pollution that enter streams. Community engagement at our local creeks not only increases awareness of human caused impacts of our urban streams, but also inspires stewardship of the watersheds we live in.
WATERSHEDS
A watershed is the area of land that drains into a specific body of water, such as a creek or lake. When it rains, runoff flows across the surfaces of parks, buildings, parking lots, and roads, where it can pick up pollutants and carry them into waterways downstream. In this way, land management practices in a watershed have a direct impact on water quality.
LIFE IN THE CREEK
Though you may not think of our local creeks as places you would encounter an abundance of fish, there are still fish in Bay Area streams! You might see steelhead trout, which are an anadromous species of fish meaning they are born in freshwater, travel to the ocean to mature, and return to freshwater streams to spawn offspring. Local creeks also host coastal roach, Sacramento sucker, and three-spined stickleback among others.
Our local creeks are also important migration corridors for wildlife, providing a sheltered linkage between upper watershed open space and the baylands below. You may see a gray fox among the trees, a great egret hunting for prey, or hear Pacific chorus frogs chirping. Many birds utilize the continuous canopy of native oaks, buckeyes, willows, and other trees that still exist along local creeks.

WHAT ARE WE MONITORING FOR?
A healthy stream supports a biodiversity of life on land and in water. However, pollution and other human impacts in a watershed can negatively alter water quality and aquatic habitat. Part of our monitoring process includes measuring seven different parameters to determine the health of creeks:
Specific Conductivity
Specific conductivity,or how well electricity flows through water, is determined by the saltiness of the water and is measured in µS/cm (microsiemens per centimeter). Each creek has its own normal baseline, since salts naturally enter the water through the breakdown of nearby rock and soil. Some local seeps have enough salts to precipitate out as stalactites, like at Soda Rock near Stevens Creek. Conductivity can be impacted by added salts from fertilizers, pesticides, and increased land erosion from construction, reducing aquatic habitability. Normal freshwater creeks have a specific conductivity of 200-1000 µS/cm (3).
pH
pH ranges from 0 to 14 and describes how acidic or basic (think vinegar versus soap) water is—0 being the most acidic, 7 being neutral, and 14 being the most basic. A normal stream pH is between 6.5 and 8.5 (1). A stream's pH is largely determined by the local geology of the area. If the pH is too high or too low, this can lead to aquatic life stress and die-off. Pollution sources that might cause a creek’s pH to become too acidic include acid rain, urban runoff, mining and wastewater discharge. On the other hand, detergents, soaps and cement can cause pH to become too basic (2).

Turbidity
Turbidity measured in NTU (nephelometric turbidity units), is a measure of how murky water is. Throughout the year, most Mediterranean streams have low turbidity (e.g. clear water) with the exception of winter floods that cause high turbidity due to land runoff and increased flows. Water released from dams can have high turbidity, carrying sediments like silt and clay downstream. These deposits can bury cobble beds in the creek, decreasing spawning habitat for fish and refugia for aquatic invertebrates (4).
Dissolved Oxygen (DO)
Dissolved oxygen, measured in mg/L (milligrams per liter) and % (percent) saturation, refers to the amount of oxygen mixed in water. Almost all aquatic life needs oxygen in water to live. Eutrophication—the depletion of dissolved oxygen due the decay of algal blooms fueled by high nutrient runoff such as fertilizer— can cause massive die-off in aquatic life. Fresh cold water habitat should have a minimum dissolved oxygen of 7.0 mg/L and fresh warm water habitat should have a minimum of dissolved oxygen of 5.0 mg/L (1).
Trash
Trash, discarded waste from humans, is another pollutant that is monitored in creeks. Trash can be introduced to creeks directly, or be deposited from rains carrying urban runoff or wind carrying lightweight trash from land. Illegal dumping and careless disposal of waste degrades habitat, poisons wildlife, and can cause serious diseases.
Nitrates
Nitrates, measured in mg/L, is a form of nitrogen that is an essential nutrient for plant and animal health. However, excess amounts can lead to eutrophication of streams and nitrogen poisoning to both aquatic and terrestrial life. Drinking water should have nitrate concentrations lower than 10 mg/L (5). Drinking water above this amount is particularly hazardous to infants, causing “blue-baby” syndrome.
Water Temperature
Water temperature, measured in °C (degrees Celsius), is a measurement of how hot or cold water is. Depending on the source of water and amount of shade, streams can be cold or warm habitats for aquatic life. Thermal pollution such as warm water discharge from a dam, or treated water from a sewage treatment plant can disrupt the normal water temperature of the creek (1).
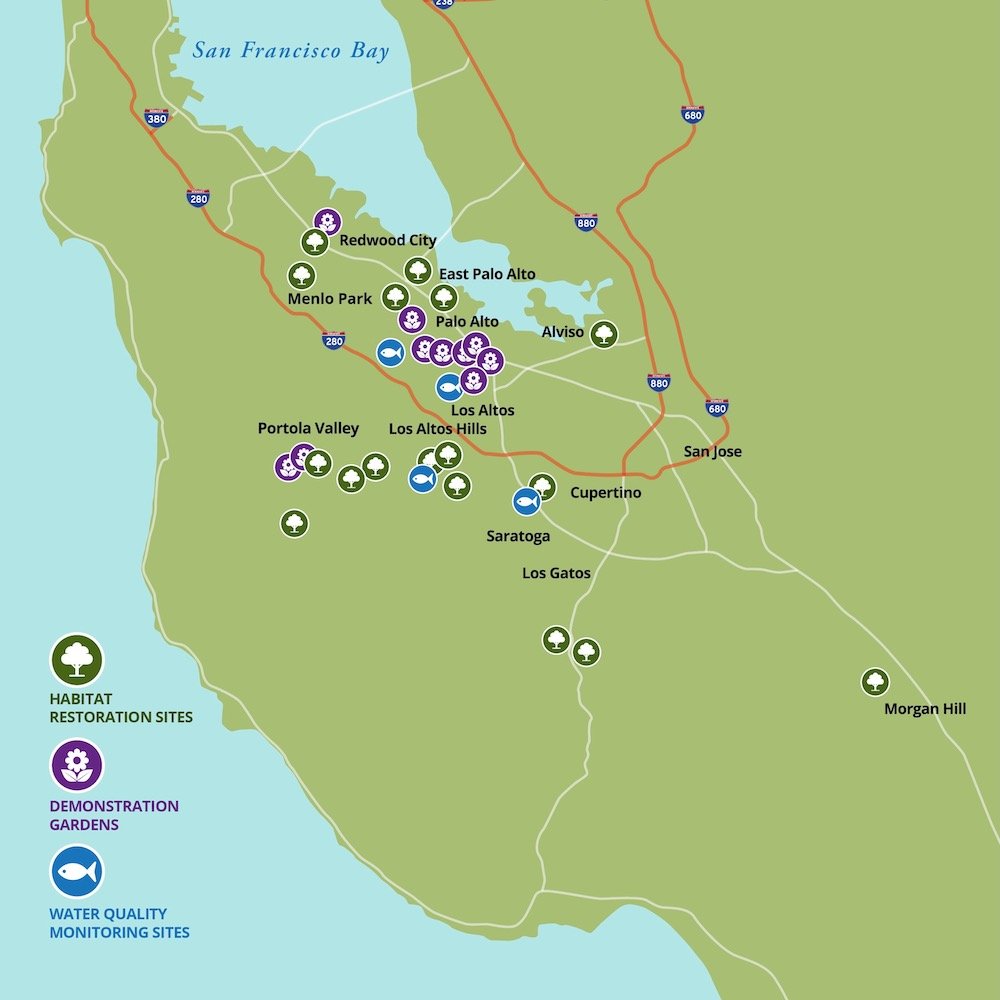
CREEKS WE MONITOR
With the help of volunteers, Grassroots Ecology monitors four local creeks in Santa Clara and San Mateo Counties:
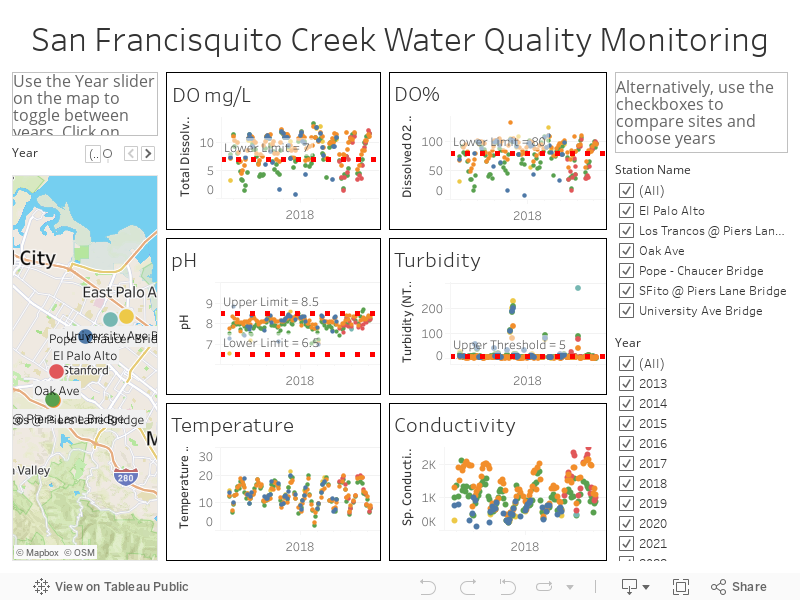
San Francisquito Creek
The upper portion of the San Francisquito Creek watershed begins in the Santa Cruz Mountains. There are three main tributaries (smaller streams that flow into a larger body of water) that feed into the main stem of San Francisquito Creek: Los Trancos Creek, Corte Madera Creek, and Bear Creek. These waterways flow a combined 33 miles through Portola Valley, Woodside, Menlo Park, Palo Alto, and East Palo Alto and eventually drain into the San Francisco Bay.
Steelhead trout can still be found in the watershed but encounter many challenges. The Searsville Dam in Jasper Ridge Biological Preserve prevents steelhead from reaching upper watershed spawning grounds on the Corte Madera Creek tributary. Fortunately, other smaller migration barriers in the lower watershed have been removed over the years, and fish can still access the upper watersheds of the Bear Creek and Los Trancos Creek tributaries. Although the lower portion of the creek was never channelized in concrete like other creeks in the area, its flow is severely limited in drought years and the lower reaches of the creek are typically dry for much of the year.

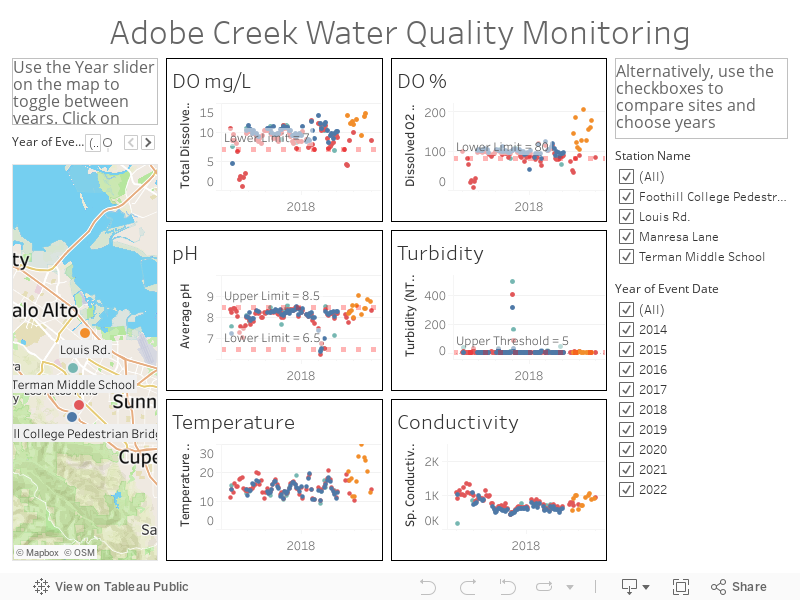
Adobe Creek
Adobe Creek begins at the Black Mountain summit of the Santa Cruz Mountains, winding through Los Altos Hills, Los Altos, and Palo Alto on its way to the Palo Alto Flood Basin and the San Francisco Bay. Most of the upper watershed land is owned by the nonprofit Hidden Villa and the Midpeninsula Open Space District. On its journey, it travels 14.2 miles, meandering through community parks, and under Highway 101.
Steelhead trout have not been spotted on Adobe Creek since the late 1980s, but other native fish including California roach, Sacramento sucker, three-spined stickleback, and prickly sculpin have been found in the creek more recently. The loss of steelhead trout is due to multiple factors including partial fish passage barriers, loss of flow due to wells, diversions for irrigation, channelization of the lower creek, and periodic closure of the tidal gate in the Flood Basin.
In 2000 low oxygen conditions in the lower watershed caused a fish die-off, prompting the City of Palo Alto to begin a volunteer monitoring program of the creek, now run by Grassroots Ecology.

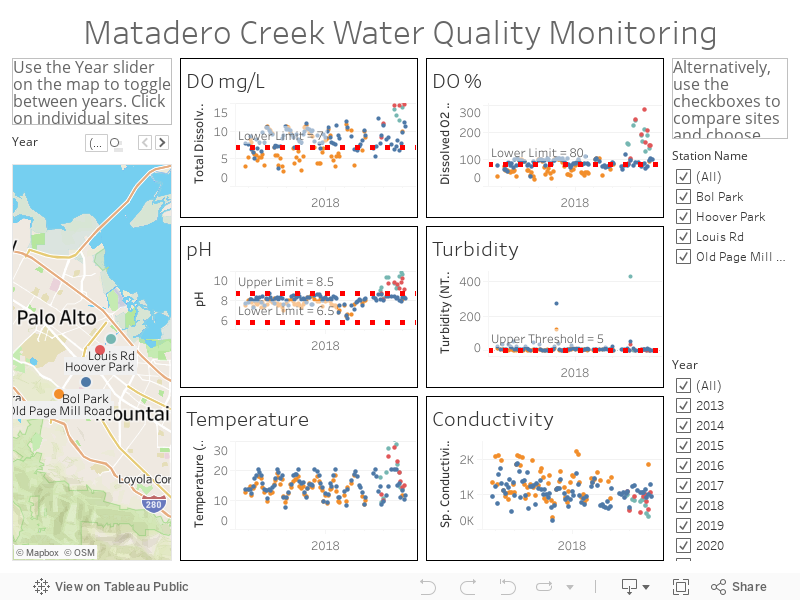
Matadero Creek
Matadero Creek’s course begins near Altamont Road and Black Mountain Road in Los Altos Hills. It passes through Palo Alto Hills before entering a concrete channel at El Camino Real that leads the creek through Midtown Palo Alto, and under Highway 101 to the Palo Alto Flood Basin.
Steelhead trout historically swam through Matadero Creek’s waters, but have not been reported there since the late 1980s.

Stevens Creek
Stevens Creek begins in the Santa Cruz Mountains in Monte Bello Open Space Preserve. It flows southward along the San Andreas fault line until it reaches Stevens Creek County Park at which point it changes direction and flows northward through Cupertino, Los Altos, Sunnyvale, and Mountain View before finally draining into the San Francisco Bay.
Stevens Creek serves as a critical habitat for steelhead trout (6). However, the Stevens Creek reservoir dam is a major fish barrier, and releases water downstream that is low in dissolved oxygen and high in temperature and turbidity. In Stevens Creek, waters with no oxygen lead to toxic methylmercury bioaccumulation, poisoning all life that make the creek their home (7). Consistently turbid water also decreases the quality of fish habitat by adding sediment that buries cobbles, decreasing egg laying locations and habitat for aquatic insects that are the food source of fish.

MONITORING METHODS
Grassroots Ecology and the volunteers that participate in the water quality monitoring program follow strict standard procedures.
WATER QUALITY DATA
We have been collecting water quality data since 2004. Explore our data from local creeks:
We previously monitored Barron Creek.
DATA NOTES
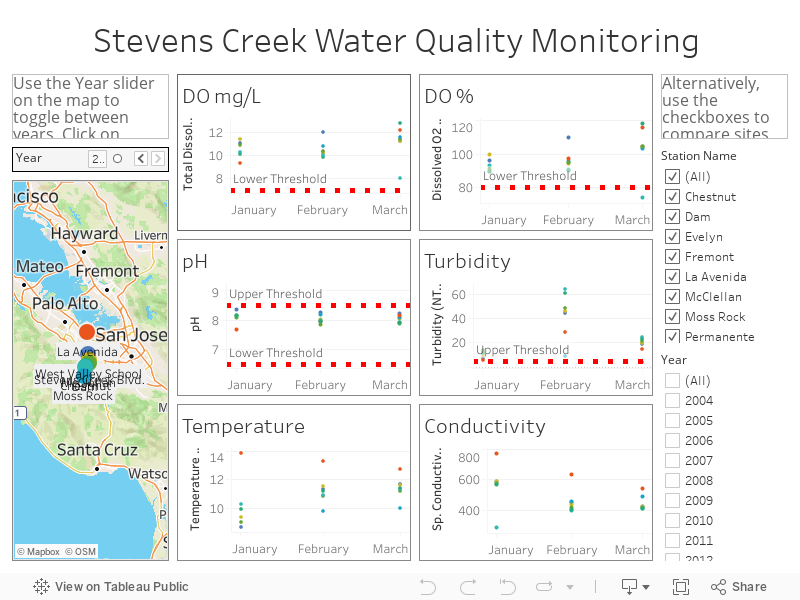
The red thresholds marked on these tables are from the State Water Resources Control Board Basin Plan. These are ideal levels, and levels above the maximum or below minimum criteria do not necessarily indicate that the creek has human-caused pollution or that the fish and other life forms will die off. In particular, oxygen and turbidity are observed outside the ideal range during certain times of the year:
Seasonally, dissolved oxygen drops as temperatures rise in the summer. Our readings are often below ideal levels, but we have not yet found dissolved oxygen to be so low as to correlate with any fish kills. High turbidity levels were recorded between December 2016 and February 2017 for all the creeks. During those winter months there were an abnormally high amount of atmospheric rivers, which led to high water levels in creeks. This caused turbidity levels to be unusually high for a short period of time—turbidity was back to its normal level later that winter and spring. The spike in turbidity on San Francisquito Creek in January 2019 is similarly due to water quality monitoring occurring during or soon after heavy rain storms.
Our water quality monitoring work has been funded by grants from Valley Water, the City of Palo Alto, and the Guadalupe-Coyote Resource Conservation District.
RESOURCES
California Regional Water Quality Control Board San Francisco Bay Region. (2019). San Francisco Bay Basin (Region 2) Water Quality Control Plan (Basin Plan): Chapter 3: Water Quality Objectives. https://www.waterboards.ca.gov/sanfranciscobay/water_issues/programs/planningtmdls/basinplan/web/docs/ADA_compliant/BP_chapter_3.pdf
Fondriest Environmental, Inc. (2013). Fundamentals of Environmental Measurements: pH of Water.
https://www.fondriest.com/environmental-measurements/parameters/water-quality/ph/Canada. Environment and Natural Resources. Conductivity. https://www.enr.gov.nt.ca/sites/enr/files/conductivity.pdf
United States Geological Survey. (1965). Water Science School: Turbidity and Water.
https://www.usgs.gov/special-topic/water-science-school/science/turbidity-and-water?qt-science_center_objects=0#qt-science_center_objectsUnited States Geological Survey. (1965). Water Science School: Nitrogen and Water.
https://www.usgs.gov/special-topic/water-science-school/science/nitrogen-and-water?qt-science_center_objects=0#qt-science_center_objectsLeidy, R. A. (2007). Ecology, Assemblage Structure, Distribution, and Status of Fishes in Streams Tributary to the San Francisco Estuary, California. San Francisco Estuary Institute.
https://www.sfei.org/sites/default/files/general_content/No530_Leidy_FullReport_revised_0.pdfCounty of Santa Clara. Santa Clara County Parks. (2004). Mercury Found In County Reservoirs. https://www.sccgov.org/sites/parks/parkfinder/Pages/MercuryFoundInReservoirs.aspx
